


List of applications used in the test:

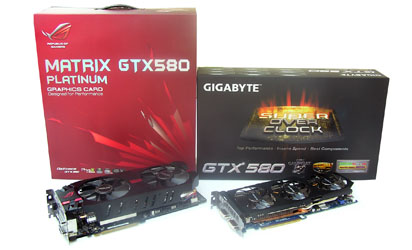
 ASUS GTX 580 Matrix Platinum on factory OC clocks
Of course, in the first round we performed the measurements with the card's factory-set clock signals, then in the second phase we set the further tuned clock signals with the card's own utility called GPU Tweak based on Over@locker886's tips, according to which the GPU voltage was set to 1,15 V, we also increased the voltage of the RAMs to 1,75 V, which is how the 949/1898/4608 MHz frequencies were formed.


GIGABYTE GeForce GTX 580 SuperOverClock:
 GIGABYTE GTX 580 SOC on factory OC clocks

GIGABYTE GTX 580 SOCa on its own OC clocks

In the case of the GIGABYTE GTX 580 SOC, the voltages were also increased to 1,15 V and 1,75 V, so it is not surprising that at these values practically the same frequencies proved to be stable as in the case of the ASUS GTX 580 Matrix Platinum. . GIGABYTE’s OC Guru program is otherwise as easy and easy to use as ASUS’s GPU Tweak app.
Using graphics drivers:
Before describing the results of the tests, we need to clarify how we performed them. For the synthetic measurements (3DMark11, 3DMark Vantage / PhysX off /, Unigine Heaven Benchmark, Mars) the GeForce driver settings were not checked, everything ran according to the factory configuration. However, after the synthetic measurements, we manually turned on the 16 × anisotropic filtering for both drives for the games, because in many applications this is not possible from the program, but we felt its presence was necessary for the measurements.

Consumption and heating measurement:
Opponents were also subjected to consumption and warm-up measurements. The appetite of the cards was examined with a wattmeter by recording the value of no-load consumption at rest under Windows, this time we tested the systems with Blu-ray and Furmark running at load. During all measurements, we tried to form an approximate average from the data seen, but as these are not measurements performed under laboratory conditions, they are for information only. MSI Afterburner 2.2 beta 5 was used to monitor temperature values, load levels, and fan speeds, monitoring was performed after a brief rest period during the FurMark load phase, and then the cards were allowed to cool.

It is clear from the table that we obtained much lower consumption values than the GIGABYTE GTX 580 SOC. We have no specific explanation for this degree of deviation, we have no maximum tips. It is possible that for some reason FurMark did not load the two cards equally, or that the beta driver caused oddities in this regard. It is also possible that GIGABYTE's dynamically controlled power supply works efficiently, although at full load it is still difficult to achieve. In any case, in our case, the wattmeter showed this, the other issue is that for such a card, consumption is not the primary factor.
Examination of the clocks, temperature data, load and fan speed of the cards working in the configurations:

ASUS GTX 580 Matrix Platinum base clock

ASUS GTX 580 Matrix Platinum tuned clock at 100% speed

GIGABYTE GeForce GTX 580 SuperOverClock at basic clock speed

GIGABYTE GeForce GTX 580 SuperOverClock with tuned clock


